
“Real-Time” can be defined as a system’s ability to to respond to inputs or events in a timely manner, in order to meet an imposed timing “deadline”. Failure to meet the deadline in a Hard Real-Time system is a catastrophic failure. In a Soft Real-Time system, however, occasional deadline violations are permitted, the occurrences of which must be gracefully handled to prevent a catastrophic failure. A Real-Time Operating System (RTOS) is an operating system which is suitable for use as part of a Real-Time system, where timing deadlines for applications, or tasks, should not be violated.
Linux and PREEMPT_RT
The Linux kernel is responsible for handling many critical low-level system tasks, such as disk or networking I/O, as well as context-critical tasks such as interrupt handlers. Typically, these critical sections of kernel code may disable interrupts or preemption entirely during their execution to ensure that their execution is not interrupted. Furthermore, in a symmetric multiprocessing (SMP) system, critical sections may also be protected by various locking and synchronisation mechanisms (such as spinlocks) to prevent multiple CPUs entering the same region of code at the same time. These protections therefore make these parts of the kernel non-preemptible. As a result, long running, non-preemptible operations inside the kernel may introduce unbounded delays to the execution of our application.
For several years, an out-of-tree “real-time patchset” has been under development, aiming to replace as much of the kernel’s non-preemptible code with preemptible alternatives (read it’s interesting history here). For example, spinlocks may be replaced with blocking mutexes which are priority-aware mechanisms that support preemption. Additionally, interrupt service routines (ISRs) which would typically preempt the CPU when an interrupt is received, are moved to their own threads.
Parts of the real-time patchset have been incrementally merged into the mainline kernel. Linux 6.12 marks a major milestone in this process: with this release, the majority of the real-time (RT) patches have been fully merged into the mainline kernel. As a result, real-time support can now be enabled on most architectures without the need to apply any additional patches.
Configuring Linux for Real Time
Real-time support can be enabled on Linux though the CONFIG_PREEMPT_RT kconfig option. The description of this configuration option given by menuconfig gives a more detailed explanation of the changes introduced by the RT patchset:
  This option turns the kernel into a real-time kernel by replacing
  various locking primitives (spinlocks, rwlocks, etc.) with
  preemptible priority-inheritance aware variants, enforcing
  interrupt threading and introducing mechanisms to break up long
  non-preemptible sections. This makes the kernel, except for very
  low level and critical code paths (entry code, scheduler, low
  level interrupt handling) fully preemptible and brings most
  execution contexts under scheduler control.

  Select this if you are building a kernel for systems which
  require real-time guarantees.
After we have enabled the PREEMPT_RT configuration option and rebuilt the kernel, we can verify that we’re running an RT-enabled kernel using uname -a, which should report PREEMPT_RT:
root@imx8qm-var-som:~# uname -a
Linux imx8qm-var-som 6.6.52-rt43-var-lts-next-gfc7261f35116 #1 SMP PREEMPT_RT Thu May 15 11:39:44 UTC 2025 aarch64 GNU/Linux
However, simply enabling PREEMPT_RT does not guarantee that the system will meet its real-time deadlines. Linux is a general purpose operating system and, whilst enabling PREEMPT_RT considerably improves its real-time capabilities, it’s still up to the system designer to understand and use those capabilities correctly. For example, even with PREEMPT_RT enabled, some kernel features may still introduce unbounded latencies and should be avoided. That’s why real-time applications should be written with real-time principles in mind, such as those presented in this checklist for writing real time applications in linux. It’s also worth noting that the real-time performance may also be limited by the chosen hardware.
Latency profiling with cyclictest
The rt-tests suite contains a range of benchmarking and test applications that can help us asses and validate the real-time performance of our system.
To demonstrate the value of these tools, we’ll examine the performance of an NXP i.MX 8-QM based SoM. This includes four ARM Cortex-A53 cores clocked at up to 1.2GHz, and two ARM Cortex-A72 cores clocked at up to 1.6GHz. We’ve set up a basic Yocto image for our board, with Linux kernel version 6.6.52 and have also applied the out of tree RT-patches for this kernel version.
To benchmark the system’s timer latency, we’ll be using cyclictest. The cyclictest tool allows us to measure the system’s timer latency. In other words, it measures how long it takes for a timer to fire after it was scheduled. It does this by using a high-resolution user-space timer, such as clock_nanosleep(), to sleep for fixed period of time. Once the application resumes, the total latency can be calculated by taking the difference between the expected wake up time and the actual wake up time. By default, cyclictest will report min, max, and average latencies, in microseconds. However, cyclictest can also output histogram data with the --histogram or --histofall flags allowing us to produce a latency plot, which provides a much more detailed snapshot of the system’s performance. It is important to run cyclictest for long enough to collect a large enough sample size, usually several hours.
Configuring cyclictest
It is also important to choose the correct set of parameters for cyclictest depending on our system’s configuration. cyclictest includes the --smp flag that automatically sets options common for testing on an SMP system (this flag is actually shorthand for --threads --affinity – which on a system with N processors, will spawn N cyclictest threads, each pinned to a single processor). --mlockall will use the mlockall() system call to lock the application’s memory, preventing it from being paged in and out by the kernel (which can be a very slow operation). These arguments enable functionality within cyclictest that a well-built real-time application should be using (such as using mlockall()). This means the results produced by cyclictest are representative of a typical real-time application. Additionally, the --interval argument allows us to set the interval that cyclictest will use for the sleep timer.
While the --smp flag provides basic settings for benchmarking real-time performance on an SMP system, there are further factors to take into account. For example, concurrent processes running on the same CPU core can affect our results by introducing additional latencies (for example, due to process scheduling) that are not strictly caused by the kernel itself. To mitigate this, we’d like to set aside some CPU cores and keep them free from running any other processes, then run our cyclictest benchmark on those cores only. This technique follows recommended practice when running real-time tasks, and ensures that our results are representative and limits the influence of external factors outside of the kernel and cyclictest.
We can use the isolcpus= kernel argument to prevent a subset of CPU cores from being used by the scheduler. If we boot our system with isolcpus=2,3,4,5, the system will not schedule any processes on those CPU cores. (Under Linux, the four A53 cores on our hardware are presented as CPUs 0-3, and the two A72’s are presented as CPUs 4-5). We can verify this using the command ps -e -o pid,psr,cmd (the “psr” column denotes the current CPU core). Using awk, we can then filter by a specific CPU core number:
$ CORE=3; ps -eL -o pid,psr,cmd | awk -v core="$CORE" 'NR == 1 || $2 == core'
     PID PSR CMD
      40   3 [cpuhp/3]
      41   3 [irq_work/3]
      42   3 [migration/3]
      43   3 [rcuc/3]
      44   3 [ktimers/3]
      45   3 [ksoftirqd/3]
      46   3 [kworker/3:0-events]
     167   3 [kworker/3:1-events]
We can see that, apart from a few kthreads (denoted with square brackets), there are no processes running on this CPU core.
We can explicitly tell cyclictest to use only those isolated cores for it’s benchmarking threads using the --affinity=<cpu list> flag (we could also use the taskset utility to achieve the same effect). We also want to set --threads so that one benchmarking thread will be started for each CPU core. The full set of arguments passed to cyclictest then becomes:
$ cyclictest --mainaffinity=0,1 --affinity=2,3,4,5 --threads --default-system --mlockall --quiet --priority=99 --interval=200 --histofall=400 --json=results.json --histfile=hist.txtNote that we also explicitly pin the main cyclictest thread to the cores 0,1. This will also prevent the main cyclictest thread from running on our isolated cores. We’re also setting the --default-system flag to prevent cyclictest from automatically attempting to tune the system’s performance, and we also set the real-time priority for each thread to 99 (maximum priority).
It’s also important to know how the system will perform under load. Considering the performance of the system only when idle does not give us the full picture. If our application has specific real-time requirements, we’d require the system to still be able to meet the real-time deadlines even if the system is bogged down with other tasks. Repeating the cyclictest benchmark under full system load helps us to establish a real-world worst-case latency profile.
We can use a tool like stress-ng to create an artificial load on the system. We’ll define three test conditions: “no load” with no stressor, “memory load” using stress-ng to run memory intensive operations, and “CPU load” again using stress-ng to run computationally expensive operations. We used the taskset utility to pin stressors to the non-isolated CPU cores, in order to simulate an intensive non-RT task running alongside the RT application. The commands used for creating memory and CPU load were:
$ taskset --cpu-list 0,1 stress-ng --vm 2 --vm-bytes 1G
$ taskset --cpu-list 0,1 stress-ng --cpu 2
Reviewing Cyclictest Results
Let’s take a look at the output from the cyclictest histogram:
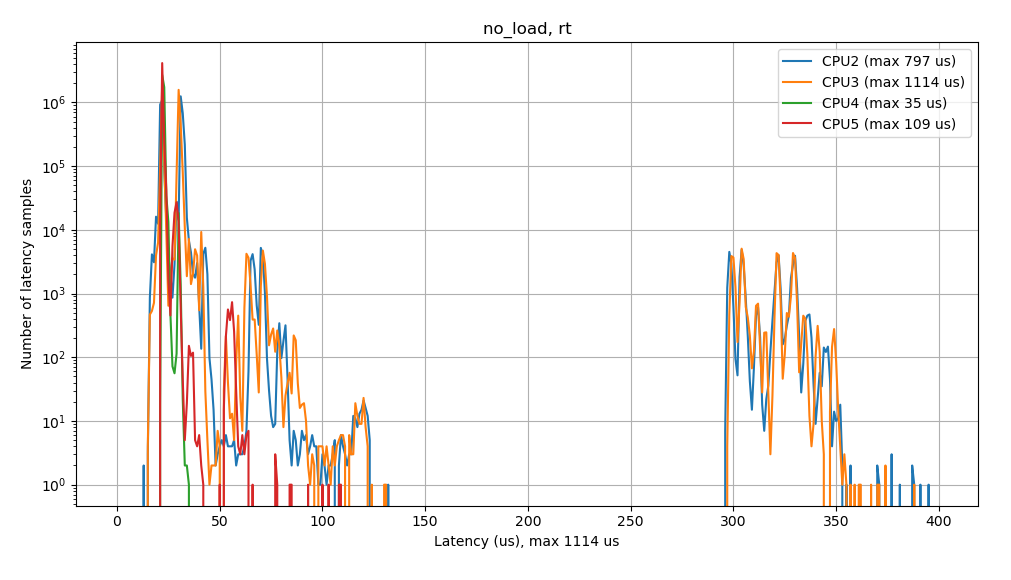
From the plot shown above, we can see that the latency profile is fairly wide (i.e. from ~12 us to ~132 us), and there is also a second cluster from ~295 us to 395 us. We can also see from the logs provided by cyclictest that the maximum latency was 1114 us, though this isn’t shown in the histogram plot.
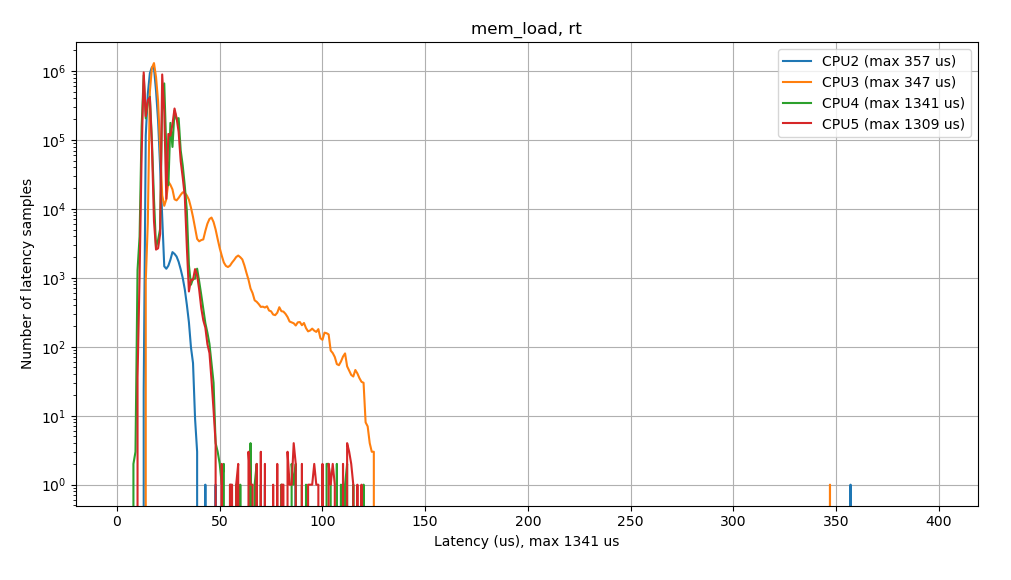
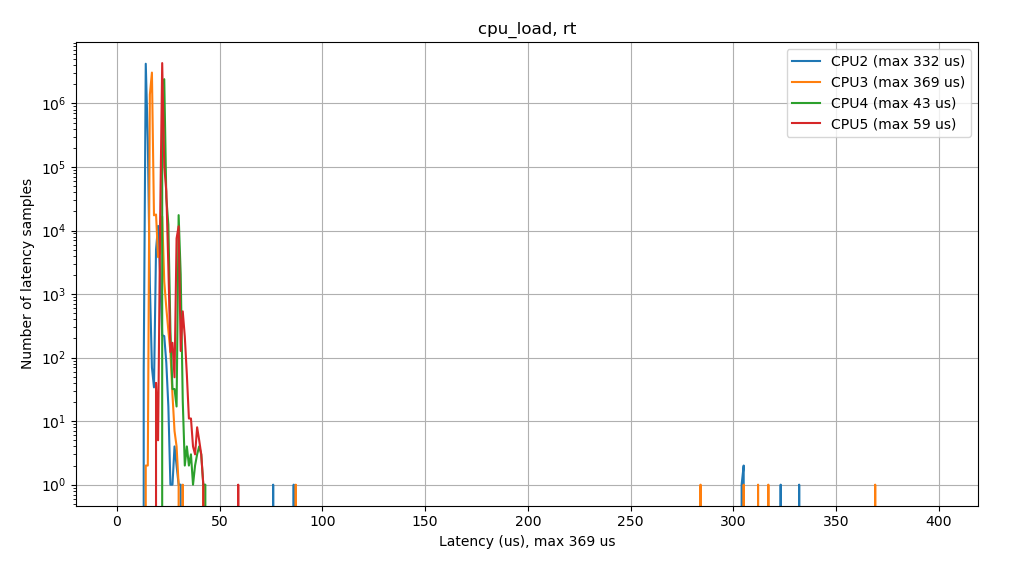
When testing under memory load, we see a similar wide profile (latencies ~7 us to ~125 us), along with outliers >350 us. Here, again we see a maximum latency of 1341 us (not shown on the graph), while under CPU load, we see a narrower latency profile, from ~12 us to ~45 us, but there were still high latency outliers with a maximum latency of 369 us.
In an optimally configured system, we would expect to see a single, narrow cluster of results where occurrences of high latencies fall off as latency values increase, and there should be no high latency outliers. As we work to optimise our kernel configuration, we will aim to reduce the maximum latency until we achieve the desired latency profile. Now let’s investigate why we’re not seeing the expected latency profile.
Cyclictest is a useful tool that provides us with an easy way to validate the real-time performance of applications running on a system. However, the latency plots produced by cyclictest alone do not help us identify where these sources of high latency come from. Now, we could begin making changes to our kernel config, experimenting with enabling and disabling certain kernel features. We could then collect a new set of results with cyclictest and compare those with our initial results. While this “black-box” approach works, it can be a time consuming trial and error process, given the vast number of configuration options available to us.
We’re not totally out of luck, the Linux kernel includes a set of built-in tracing and profiling mechanisms which can be enabled through various kconfig options. These tracers, once enabled, are exposed to us via the tracefs interface. However, interfacing with the tracing mechanisms through this interface is cumbersome and can be tedious to set up correctly. They also produce a lot of detailed information that can sometimes be difficult to understand easily. This is where the real-time Linux analysis tool, or rtla, can help us.
Real-time Linux analysis tool
The rtla tool leverages the kernel’s built-in tracing and profiling mechanisms to provide an easy to use interface through which we can analyse the real-time performance of the kernel, greatly simplifying the debugging process by replacing the need to directly interact with the tracefs interface. The rtla suite consists of several tools for measuring different classes of latency sources:
- osnoise: Uses the osnoise tracer with all potential sources of operating system noise enabled (for example, preemption, softirqs and IRQs).
- hwnoise: Also uses the osnoise tracer, but with interrupts disabled. Allows for analysis of noise caused by non-maskable interrupts and other hardware-related sources.
- timerlat: An interface for the timerlat tracer, used to measure timer IRQ and thread latency.
Enabling kernel tracing
In order to be able to use rtla, we need to ensure that we’re using a kernel that has tracing support built-in. This can be done by enabling the kconfig options:
CONFIG_TRACING=y
CONFIG_FTRACE=y
Additionally, we will also want to enable some tracers:
CONFIG_OSNOISE_TRACER=y
CONFIG_HWLAT_TRACER=y
CONFIG_TIMERLAT_TRACER=y
We can check that our kernel has tracing enabled by checking for the tracefs mount on /sys/kernel/tracing. Through this interface we can also check the kernel tracers available to us:
root@imx8qm-var-som:~# mount | grep tracefs
tracefs on /sys/kernel/tracing type tracefs (rw,nosuid,nodev,noexec,relatime)
root@imx8qm-var-som:~# cat /sys/kernel/tracing/available_tracers
timerlat osnoise hwlat function_graph wakeup_dl wakeup_rt wakeup preemptirqsoff preemptoff irqsoff function nop
Optimising latency with rtla timerlat
The rtla timerlat tool behaves similarly to cyclictest – it schedules a timer, sleeps on this timer, and then measures latencies by calculating the difference between the expected and actual wake-up times. rtla timerlat goes a step further than cyclictest. Upon detecting a latency higher than our set threshold, it will produce a kernel stack trace of the blocking thread along with timing information for the thread. This will allow us to see why the kernel was unable to schedule our application within the deadline, pointing us directly to the part of the kernel that caused this latency.
Now we can start cyclictest again, just as we did before in our initial testing under no load. Then, we’ll run rtla timerlat top simultaneously on the same set of isolated cores, in a new shell:
root@imx8qm-var-som:~# rtla timerlat top --cpus 2,3,4,5 --auto 325Here we use the --cpus argument to run the tracer only on our isolated cpus – the same set that we’re running cyclictest on. We also use --auto to use automatic trace mode, specifying a maximum latency threshold of 325 us. This value sits at the high end of the second cluster of latencies we saw when running cyclictest under no load. Here, it’s important to choose a suitable threshold – we want to pick a threshold high enough so that we are identifying a high latency source, but suitably low enough that there are frequent enough occurrences and we won’t have to wait too long for them to occur. For example, if we took the absolute maximum latency seen under no load, 1114 us, we might have to wait several hours for us to experience a latency above this value due to the fact that latencies higher than this value only occur very rarely.
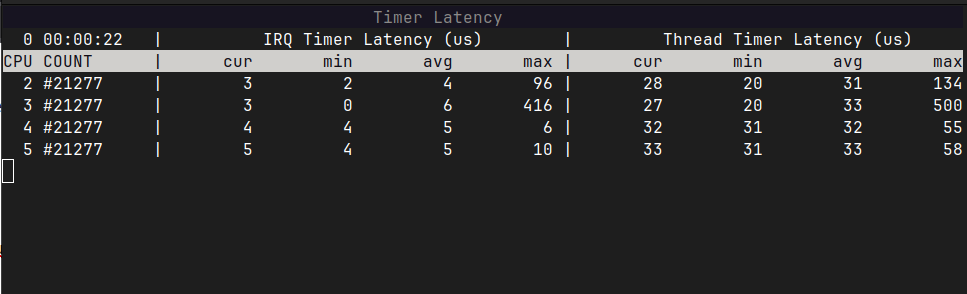
While the rtla timerlat top command runs, it shows a breakdown of the current, minimum, average and maximum IRQ and thread timer latencies for each CPU core. We can see in the screenshot above, across CPU cores 2-5, that timerlat top is reporting average IRQ timer latencies in the range 4-6 us, while average thread timer latencies are in the range 31-33 us. The maximum IRQ timer latencies are in the range 6-416 us and maximum thread timer latencies are in the range 55-500 us.
After letting cyclictest and timerlat run for several minutes, we eventually see that our latency threshold of 325 us has been exceeded. rtla has produced a kernel stack trace for the offending CPU core, along with detailed timing information. rtla will also write additional information to timerlat_trace.txt. We can use the kernel stack trace to identify the cause of this latency spike.
$ rtla timerlat hit stop tracing
  CPU 2 hit stop tracing, analyzing it ##
  IRQ handler delay:                                       443.94 us (83.59 %)
    IRQ latency:                                             447.94 us
    Timerlat IRQ duration:                                    23.38 us (4.40 %)
    Blocking thread:                                           6.38 us (1.20 %)
                       kworker/2:1:167                         6.38 us
      Blocking thread stack trace
                  -> timerlat_irq
                  -> __hrtimer_run_queues
                  -> hrtimer_interrupt
                  -> arch_timer_handler_phys
                  -> handle_percpu_devid_irq
                  -> generic_handle_domain_irq
                  -> gic_handle_irq
                  -> call_on_irq_stack
                  -> do_interrupt_handler
                  -> el1_interrupt
                  -> el1h_64_irq_handler
                  -> el1h_64_irq
                  -> __arm_smccc_smc
                  -> clk_scu_atf_set_cpu_rate
                  -> clk_change_rate
                  -> clk_core_set_rate_nolock
                  -> clk_set_rate
                  -> _opp_config_clk_single
                  -> _set_opp
                  -> dev_pm_opp_set_rate
                  -> set_target
                  -> __cpufreq_driver_target
                  -> od_dbs_update
                  -> dbs_work_handler
                  -> process_one_work
                  -> worker_thread
                  -> kthread
                  -> ret_from_fork
    IRQ interference                                           3.62 us (0.68 %)
                  arch_timer:11                                3.62 us
    Thread interference                                       32.12 us (6.05 %)
                  cyclictest:1583                             16.75 us
                  cyclictest:1583                             15.38 us
  Thread latency:                                          531.06 us (100%)
  Max timerlat IRQ latency from idle: 72.81 us in cpu 3
    Saving trace to timerlat_trace.txt
The output produced by rtla timerlat shows that CPU core 2 experienced a total thread latency of 531.06 us, which can be further broken down into 443.94 us IRQ handler delay, 23.38 us timerlat IRQ duration, 6.38 us for the blocking thread, 3.62 us IRQ interference, and 32.12 us thread interference.
Starting from the bottom of the rtla timerlat stack trace, we can see that the blocking thread called process_one_work() from worker_thread(), which then later called the functions od_dbs_update() and __cpufreq_driver_target(), eventually calling into IRQ handling code before reaching the timerlat IRQ handler. We can look up these functions in the kernel source code and see that the function od_dbs_update() is defined inside drivers/cpufreq/cpufreq_ondemand.c, which is part of the “ondemand” CPUfreq governor. Further down the call chain, we also see a call to dev_pm_opp_set_rate(), which is defined in drivers/opp/core.c. The documentation for this function states it is responsible for adjusting power supply levels corresponding to a given target frequency. The timing information in the stack trace indicates that execution of the IRQ handler was significantly delayed (by 447.94 us) and from this, we can deduce that the ondemand CPUfreq governor is at least one of the causes of this delay, as indicated by the function calls that are shown in stack trace.
Indeed, it is recommended practice to ensure that CPU frequency scaling configured appropriately, as dynamic frequency scaling often introduces variations in performance and is a known source of high latencies. We can eliminate this latency source by switching to the “performance” CPUfreq governor instead. This will set the CPU statically to it’s maximum supported frequency. We can change the default CPUfreq governor from “ondemand” to “performance” with the following kconfig options:
CONFIG_CPU_FREQ_DEFAULT_GOV_PERFORMANCE=y
# CONFIG_CPU_FREQ_DEFAULT_GOV_ONDEMAND is not set
We can now repeat cyclictest to see the effects of making this configuration change. Once we have obtained a new maximum latency, we can repeat the rtla timerlat diagnostic process again, with this new maximum latency value, to again identify the next highest latency source. We can continue this process until we’ve eliminated all significant latency sources and our real-time deadlines are being met.
Once we have eliminated latency sources and are now confident that we’re meeting our real-time scheduling deadlines, we can repeat our initial cyclictest benchmark in order to confirm. Here are the latency plots produced by cyclictest after tuning the kernel configuration:
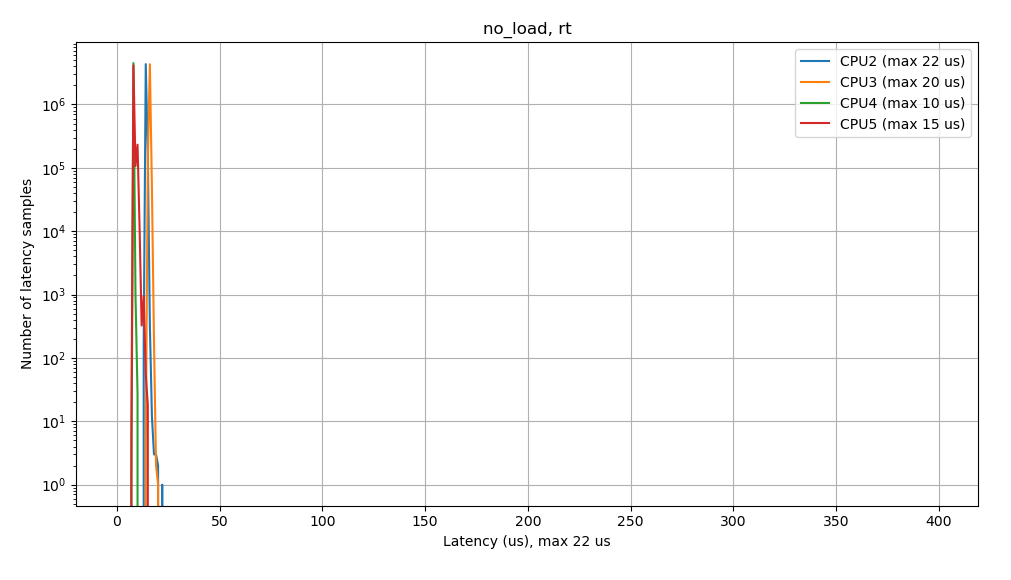
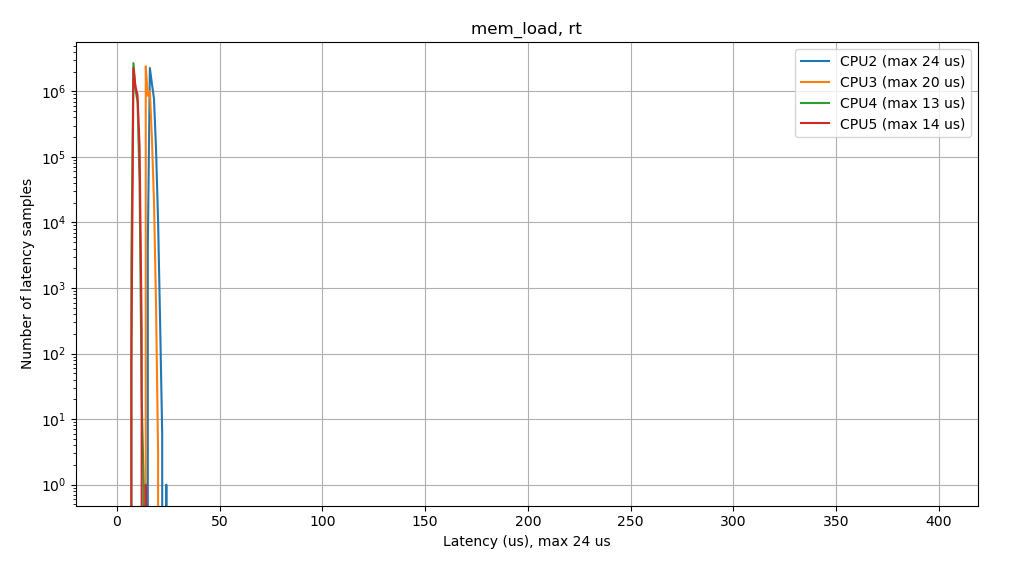
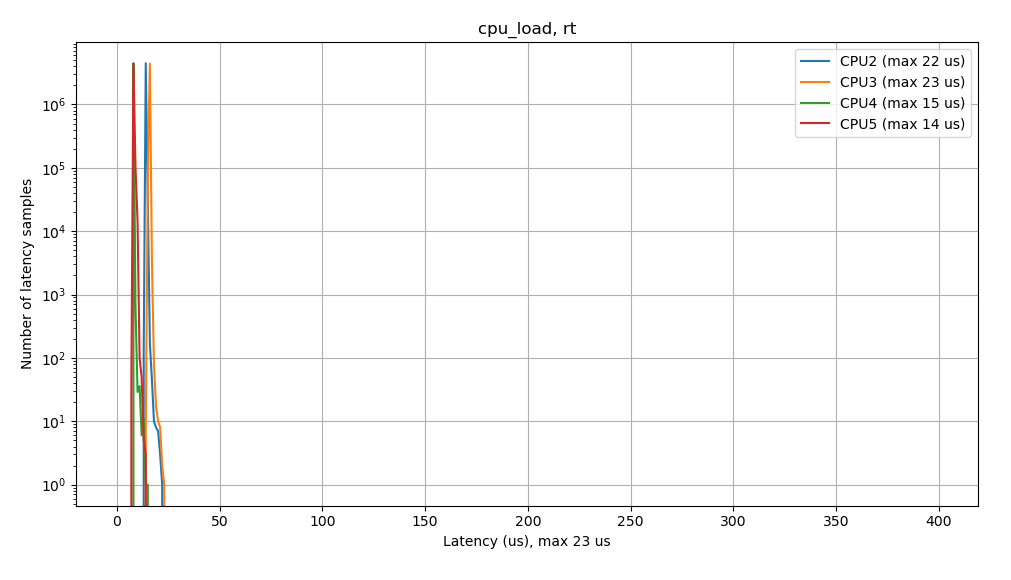
As the results from cyclictest now show, when testing the system under no load, we see a narrow latency profile, with no outliers or spikes at higher latencies. The maximum latency seen was 22 us, which was reduced from 1114 us. Additionally, this latency profile remains consistent when tested under system load, where the maximum latencies were reduced from 1341 us to 24 us under memory load, and from 369 us to 23 us under CPU load. This verifies that the configuration change we made has improved the real-time performance of our application. We can also see that low latency real-time performance is maintained even when we load down the system.
The final step is to ensure that we have removed the kernel tracing and profiling options that we enabled for rtla from our kernel defconfig, unless we need them for another purpose. These kconfig options have an associated overhead that can impact the performance and should be disabled unless we need them for other purposes.
Conclusion
In conclusion, we’ve covered what a “real-time” system is, and how the “PREEMPT_RT” patchset works to improve RT performance by replacing sections of non-preemptible code within the Linux kernel with preemptible variants. We’ve also explained how a misconfiguration in the kernel configuration can negatively affect real-time performance, and how we can use tools like cyclictest to benchmark real-time performance. Finally, we have shown that by using rtla timerlat to identify those sources of high latency, we can use this information to help us adjust our kernel config. With a tuned kernel config, our real-time performance has improved which can again be validated by using cyclictest.