
GStreamer is a widely used and comprehensive multimedia framework allowing for the creation of a wide range of multimedia applications. It has become the obvious choice for embedded Linux systems, especially given that these days most BSP vendors choose to provide GStreamer plugins for their media accelerators. It’s ease of use allows you to create monstrous pipelines with extensive functionality – however debugging them can be very challenging, often requiring extensive experience or knowledge of the inner workings of GStreamer in order to succeed. It’s at this point in the project where weeks of debugging effort can easily be consumed.
We were recently asked by a customer to help them find a memory leak in their GStreamer application. The application was complex with configurable functionality that included capturing multiple audio and video sources, streaming, recording, taking snapshots and compositing. They found that under certain conditions the memory usage of the process would grow until the Linux Out of Memory (OOM) killer would kill the process. We were able to reproduce the issue and started debugging.
We tried to characterise the bug to understand the conditions in which it occurred, we tried to understand the context with regards to when it occurred (so we could dig through Git), we tried to change the pipeline to isolate the troublesome part (difficult to pull apart), we tried to reproduce it in the smallest and simplest pipeline possible, we enabled debugging (and got drowned in the mass of data), we played with GStreamer’s tracing plugins, we came up with lots of theories but gradually disproved them all, we found ‘solutions’ that only really masked the problem… we spent lots of effort and did gain some knowledge though we were unable to even narrow down where the bug was. (I’m sure many others have had similar war stories like this.). At this point we had proven that GStreamer was allocating buffers of memory and it was these that were causing the ever growing memory use.
GStreamer is pipeline based which means that you connect a series of elements together and data flows between them. Memory allocation often happens in source elements and handles to that memory are passed down the pipeline. GStreamer uses reference counting to keep track of users of those buffers and only when the reference count goes to zero does that memory get freed. For example you may have a pipeline that splits (e.g. tee’s) into two paths, in this case the buffer will have a ref count of two. Only when both paths have finished with the buffer will the reference count go to zero and the memory be disposed. If one of those paths wishes to modify the buffer, then GStreamer will copy that buffer (such that it doesn’t effect the other path) which involves allocating memory, copying data into it, and reducing the reference count of the original buffer as its not needed by this path anymore. In the context of hunting down a memory leak, even if you know which element allocated memory, it doesn’t tell you who is responsible for freeing it – instead you have to focus on reference counting. There is a tracing plugin to help with this – this can tell you which buffers haven’t been un-referenced at the end of a pipeline’s execution, it can tell you currently ‘alive’ buffers (including a stack trace for allocation) – and it can tell you the history for each buffers reference count. Though sadly even this didn’t help us. In hindsight we would have really valued something tells us the last know location of each ‘alive’ buffer so that we can see where in the pipeline it’s got stuck – but the current tooling didn’t provide this.
Eventually one of our theories proved true and we finally understood what was happening. This all relates to the use of a pair of elements called interpipesrc and interpipesink. These elements, which are built upon appsrc and appsink, allow (ironically) for creating less complex applications as they allow for communication and data flows between multiple independent pipelines. In other words, you can break up a big complex application into smaller more manageable pipelines. Unfortunately for us, it was the interaction between these pipelines that was causing issues. It’s worth pointing out that there isn’t a memory leak in these filters, but instead the issue was in how we used them (in the same way that Chrome may not leak memory, but if you open too many tabs there will be no memory left).
Let’s start with a simple example of GstInterpipe:
$ gst-launch-1.0 \
videotestsrc ! interpipesink name=v1 \
interpipesrc listen-to=v1 ! fakesink \
interpipesrc listen-to=v1 ! fakesink
In this pipeline, videotestsrc will generate video buffers as fast as possible and send them to the interpipesink element. These buffers are then effectively tee’d off into two independent pipelines which discard them via a fakesink. Running this pipeline does not demonstrate any increasing use of memory – so far so good.
Now let’s add an ‘identity‘ element to one of the pipelines. The identity element is a diagnostic element that allows data to be passed without modification – however it also lets us do some interesting things. Below we’ve added the ‘sleep-time=1000’ parameter – this adds a 100 microsecond delay in processing each buffer that passes it.
$ gst-launch-1.0 \
videotestsrc ! interpipesink name=v1 \
interpipesrc listen-to=v1 ! fakesink \
interpipesrc listen-to=v1 ! identity sleep-time=100 ! fakesink
When we run this pipeline we see an increasing memory usage as shown below (helpfully plotted via a Python utility named mem_usage_ui):
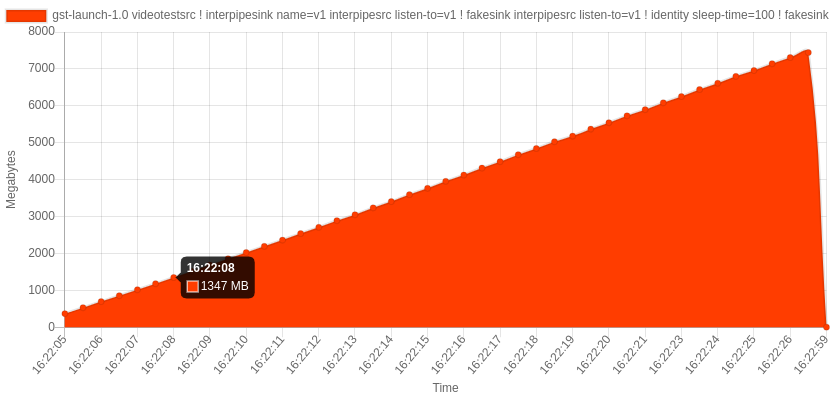
When interpipesink receives a buffer it sends it to the two additional pipelines: one with a fakesink element (let’s call this the first pipeline) and the other with an identity and fakesink element (let’s call this the second pipeline). However, due to the added processing delay the second pipeline can’t process the buffers as quickly as it’s receiving them. As a result, the buffers build up in the second pipeline’s interpipesrc internal queue. The queue is unlimited in size and so eventually we run out of memory. This isn’t a bug, this is as designed – however this is the cause of our customers issue.
We can visualise this a little better by adding debug, running the same pipeline with the GST_DEBUG environment variable set to appsrc:5 gives us the following debug when running:
appsrc gstappsrc.c:1856:gst_app_src_push_internal:<interpipesrc1> queue filled (1595059200 >= 200000)
appsrc gstappsrc.c:1856:gst_app_src_push_internal:<interpipesrc1> queue filled (1595059200 >= 200000)
appsrc gstappsrc.c:1856:gst_app_src_push_internal:<interpipesrc1> queue filled (1595174400 >= 200000)
appsrc gstappsrc.c:1856:gst_app_src_push_internal:<interpipesrc1> queue filled (1595174400 >= 200000)
appsrc gstappsrc.c:1856:gst_app_src_push_internal:<interpipesrc1> queue filled (1595289600 >= 200000)
appsrc gstappsrc.c:1856:gst_app_src_push_internal:<interpipesrc1> queue filled (1595289600 >= 200000)
appsrc gstappsrc.c:1856:gst_app_src_push_internal:<interpipesrc1> queue filled (1595404800 >= 200000)
appsrc gstappsrc.c:1856:gst_app_src_push_internal:<interpipesrc1> queue filled (1595404800 >= 200000)
You’ll notice that the ‘queue filled’ output is triggered because the queue size is bigger than a limit. This is 200000 bytes by default, but can be overridden via the max-bytes parameter. However the non-intuitive part is that when the limit is reached it will and is designed to continue to grow – this is confusing as the documentation says “The maximum number of bytes to queue internally”. But in fact what happens is that upon reaching this limit the element sends out a “enough-data” signal – the intent that someone will respond by not sending any more buffers – so it’s more of a watermark than a limit (actually the intent is clearly described in the GstAppSrc summary).
There is an easy fix to this, and that’s to set the ‘block‘ parameter to ‘true’ – this will tell the interpipesrc to not accept any more buffers once the queue reaches the set limit (the thread just blocks). When setting this, the output instead shows:
appsrc gstappsrc.c:1856:gst_app_src_push_internal:<interpipesrc1> queue filled (230400 >= 200000)
appsrc gstappsrc.c:1884:gst_app_src_push_internal:<interpipesrc1> waiting for free space
appsrc gstappsrc.c:1856:gst_app_src_push_internal:<interpipesrc1> queue filled (230400 >= 200000)
appsrc gstappsrc.c:1856:gst_app_src_push_internal:<interpipesrc1> queue filled (230400 >= 200000)
appsrc gstappsrc.c:1884:gst_app_src_push_internal:<interpipesrc1> waiting for free space
appsrc gstappsrc.c:1856:gst_app_src_push_internal:<interpipesrc1> queue filled (230400 >= 200000)
appsrc gstappsrc.c:1856:gst_app_src_push_internal:<interpipesrc1> queue filled (230400 >= 200000)
appsrc gstappsrc.c:1884:gst_app_src_push_internal:<interpipesrc1> waiting for free space
You can see that now once the limit has been reached the queue size stays the same (and as a result the memory usage doesn’t grow). I assume it goes slightly over the limit as the queue size (in bytes) does not always divide by a whole number of buffers.
With ‘block=true’ the element doesn’t accept new buffers and thus this blockage may have upstream side effects – it may fill upstream queues, cause element sources to drop buffers or cause another interpipe to blow up. The root cause here is really that our customers application couldn’t keep up with the rate of data going into it and ultimately this what we went on to examine. But in theses situations the application should always have a way to release ‘excess emergency steam’ rather than die from the OOM killer.
One solution is to companion the interpipesrc with a queue. The GStreamer ‘queue‘ element has a ‘leaky‘ parameter which allows you to control what happens when the queue is full e.g. drop the oldest buffers, drop the newest buffers, etc. Alternatively in newer versions of GStreamer, the appsrc (which interpipesrc is built upon) emulates support for the ‘leaky’ behaviour found in GStreamer queues but for its internal queue.
Of course if you allow buffers to grow you end up with increased pipeline latency (which may be OK for small periods as it may catch up) – if you drop buffers then you may end up with user noticeable artefacts. The perfect solution is one where processing time of elements is reduced – perhaps due to switching to hardware accelerated filters, using suitable video and audio formats, etc.
We gained a lot of experience in debugging GStreamer issue though this engagement but most importantly we found a good solution for our customer. Our new found knowledge has also allowed us to better understand the performance of pipelines such that we can optimise them. We hope this blog post will help others in similar situations – let us know of your experiences.