
It’s no surprise that systemd has become the init system of choice for both embedded and desktop Linux distributions – it’s modern, packed full of features and is able to replace an ever increasing number of ancient utilities and daemons. When compared to it’s predecessor (SysVinit) – it also provides a much greater scope for achieving a minimal boot time thanks in part to it’s parallelism when launching start up units. In this post we’ll take a look at the tools that systemd provides for analysing boot time and how to make sense of them.
Let’s start with the ‘systemd-analyze time‘ command – this command provides an overview of the overall system boot time:
$ systemd-analyze time
Startup finished in 2.838s (kernel) + 2.846s (userspace) = 5.684s
multi-user.target reached after 2.739s in userspace
The above output shows the time taken to start the kernel and userspace – depending on your system, you may also see other components that systemd is aware about such as the firmware, loader and initrd. Not long after systemd starts it makes a call to clock_gettime to get the current system time – this is the point where systemd considers that the kernel has ended and userspace begun. Let’s reconcile this with kernel output from dmesg:
[    2.744457] VFS: Mounted root (ext4 filesystem) readonly on device 179:2.
[    2.752522] mmc0: queuing unknown CIS tuple 0x80 (6 bytes)
[    2.762257] devtmpfs: mounted
[    2.766057] Freeing unused kernel memory: 1920K
[    2.772703] Run /sbin/init as init process
You’ll notice that the kernel launched systemd (i.e. the init process) at 2.773 seconds – yet systemd reported that the kernel finished in 2.838 – the difference in time here relates to the time it takes for the kernel to output the ‘Run /sbin/init as init process’ console message (which may be slow on a UART), the time it takes for the init process to execute (e.g. load from disk, resolve dynamic libraries, etc) and the time it takes for execution to reach the point where clock_gettime is called. In our case this time is only 65 ms.
Our systemd-analyze output also showed two (slightly different) userspace times. These represent the amount of time systemd spends from its start to the point where a given userspace ‘systemd target‘ is reached. In our case our default target is multi-user.target (a target can be thought of as a SysVinit runlevel):
$ systemctl get-default
multi-user.target
The smaller userspace time (2.739s) represents the time where the multi-user.target reached it’s ‘active’ state (i.e. the units that it depended on have been fully started) – whereas the larger userspace time (2.846) is the point in systemd where it’s completed its house keeping after reaching the target state. These figures are always similar and the difference between them represents systemd internal delays.
Finally the overall boot time listed (5.684s) is the sum of the boot times of the components known to systemd – though this isn’t representative of the full boot time as systemd isn’t aware of all boot components (e.g. SPL, U-Boot, ATF, etc). Furthermore, for embedded devices, we really only care about the time when our main application starts and provides functionality to the user – but let’s ignore this for now.
This is all interesting, but not very helpful if we want to reduce the overall boot time. Let’s take a look at ‘systemd-analyze blame‘:
$ systemd-analyze blame
1.248s dev-mmcblk2p3.device
1.082s dev-mmcblk2p2.device
 662ms systemd-resolved.service
 389ms systemd-udev-trigger.service
 369ms avahi-daemon.service
 313ms connman.service
 278ms dev-mqueue.mount
 262ms dev-hugepages.mount
 247ms tmp.mount
 237ms kmod-static-nodes.service
 233ms wpa_supplicant.service
 230ms modprobe@configfs.service
 227ms systemd-timesyncd.service
 222ms modprobe@fuse.service
 222ms ofono.service
 216ms systemd-fsck-root.service
 208ms systemd-udevd.service
 185ms systemd-sysctl.service
 147ms systemd-networkd.service
 110ms systemd-tmpfiles-setup-dev.service
  99ms systemd-journal-flush.service
  79ms systemd-journald.service
  79ms systemd-remount-fs.service
  78ms sys-kernel-config.mount
  76ms sys-fs-fuse-connections.mount
  75ms systemd-journal-catalog-update.service
  62ms var.mount
  53ms systemd-tmpfiles-setup.service
  33ms var-run-dropbear.mount
  32ms var-log-journal.mount
  31ms dropbear.service
  20ms systemd-update-done.service
This is a list of running systemd units and the amount of time they took to initialise. It’s easy to think that reducing the execution time of one of the listed units will reduce the overall boot time by the same amount – however it’s not that straight forward – This would only be true on a system like SysVinit where all the init scripts are executed one by one.
In order to achieve an optimal boot time you want system resources, such as IO and CPU to be fully utilised and doing useful work. In systemd, units are executed in parallel (subject to dependency ordering) – this is great for boot time as it means that when a unit stops being CPU-bound (perhaps because it’s waiting for an event or IO) then another unit can make use of the otherwise unused CPU.
So back to our ‘systemd-analyze blame’ output. For a given unit, the execution time will vary depending on what else the system is doing at the time – if many processes are running then each process will take longer as they will have less share of the CPU. In other words, the initialisation time listed only partly relates to the amount of work required of a unit. It’s also worth pointing out that the time listed is the ‘activation time’ – this is the amount of time it takes to bring the unit ‘up’ and is closely related to the systemd service type. Of course what the unit does after it’s ‘up’ may also have an impact on boot time if it takes resources away from other units.
Let’s assume we have three systemd units that are CPU-bound running on a single core machine – individually each takes 1 second to run – but when run together they only get a third of the CPU time, taking a combined total of 3 seconds. We’d see this in ‘systemd-analyze blame’ as three tasks each taking 3 seconds. If we then removed one of these tasks, then each task would now get half of the CPU time, thus taking a combined total of 2 seconds. So by removing a 3 second task – we’ve reduced overall boot time by 1 second – and according to ‘systemd-analyze blame’ we’ve also reduced the time of the other two remaining tasks by 1 second each. It’s for this reason why the sum of the individual unit times above doesn’t add up to the overall userspace time. So far we’ve assumed that all the tasks involve the same amount of CPU-bound work, start at the same time and have no inter dependencies. But unfortunately these aren’t realistic assumptions.
If a systemd unit has a dependency on another unit then it has to wait for that other unit to activate before running – these delays can result in system resources being under utilised. The ‘systemctl list-dependencies‘ utility can provide information about a unit’s dependencies, as shown below. This allows you to understand what a service is dependant on and what depends on it.
$ systemctl list-dependencies connman
connman.service
 ● ├─-.mount
 ● ├─dbus.socket
 ● ├─system.slice
 ● ├─var.mount
 ● └─network.target

$ systemctl list-dependencies connman --reverse
connman.service
 ● └─multi-user.target
A great and intuitive way to visualise the boot time is with ‘systemd-analyze plot‘ – running this command after boot will result in an SVG file which provides a graphical representation of the boot time – as follows.
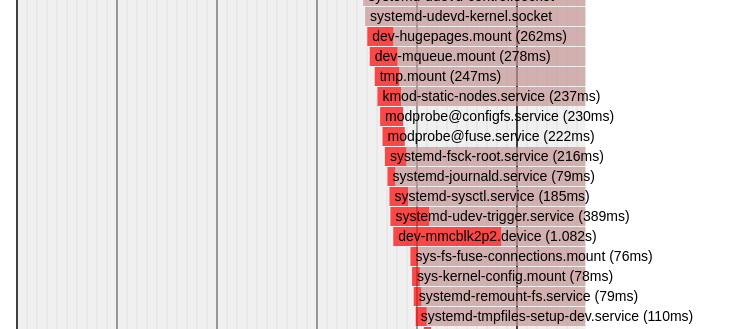
You’ll notice that the dark red colouring in a bar is used to indicate the period of time where a unit is activating. You’ll also notice that the time written inside the bar matches the output from ‘systemd-analyze blame’. Unfortunately the plot doesn’t explicitly show the dependencies between units – thus it’s not always clear why a particular unit starts when it does – though you can usually look up or down the chart and see that it aligns with the end of activation of another unit – thus implying a possible dependency.
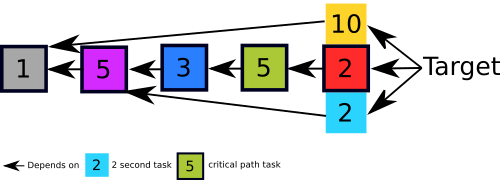
Any system, such as systemd, that has multiple tasks and dependencies between them can be represented as a directed dependency graph. If each node in the graph represents the activation time of a unit – then the longest path in the graph (when you sum up the activation times in the nodes of the path) represents the critical path/chain. Let’s consider the example below where the critical path is shown with outlined boxes.
We can also illustrate a timeline showing how and when these tasks would run given the above dependency constraints and assuming we’d start as many tasks as we can, as early as we can. For simplicity we’ll also assume these tasks take a fixed amount of time to run, regardless to the load of the system.
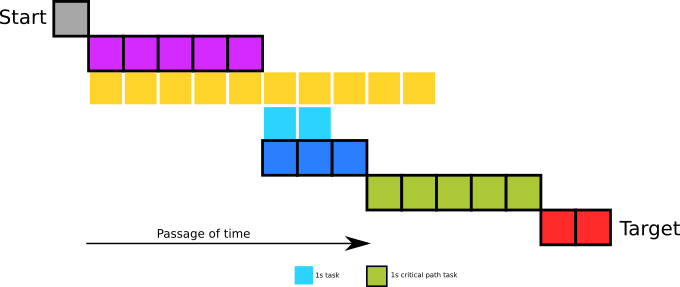
Looking at our dependency graph, the only task which has no dependencies is the gray task, so this one is started first. Once that finishes the magenta and yellow tasks which solely depended on it can now start. This process continues until the target state is reached.
Any increases in the activation time of the units in the critical chain will directly contribute to overall boot time. Reducing the execution time of these tasks will reduce the overall time and/or result in those tasks not being in the critical chain any more. For example, removing the magenta 5 second task in the critical chain above will reduce overall boot time by 5 seconds – however additionally removing the second 5 second task (green) won’t reduce the boot time any further because the target will be waiting for the yellow task to finish (i.e. the critical path will change), as shown below:

Thus the most efficient approach to reduce boot time is to analyse the critical chain. Thankfully systemd provides a command for this, let’s take a look at ‘systemd-analyze critical-chain‘:
$ systemd-analyze critical-chain multi-user.target
The time when unit became active or started is printed after the "@" character.
The time the unit took to start is printed after the "+" character.
multi-user.target @2.739s
└─dropbear.service @2.693s +31ms
  └─network.target @2.671s
    └─wpa_supplicant.service @2.417s +233ms
      └─basic.target @2.202s
        └─sockets.target @2.186s
          └─dbus.socket @2.170s
            └─sysinit.target @2.007s
              └─systemd-timesyncd.service @1.730s +227ms
                └─systemd-tmpfiles-setup.service @1.634s +53ms
                  └─systemd-journal-flush.service @1.517s +99ms
                    └─var-log-journal.mount @1.433s +32ms
                      └─dev-mmcblk2p3.device @1.280s +1.248s
We can read the output of ‘systemd-analyze critical-chain’ like this: multi-user.target is booted at 2.739 seconds after the kernel handed over to systemd. However it could have started 31 milliseconds earlier if it wasn’t held up waiting for dropbear to start. Dropbear could only start after network.target was ready – but there was no material delay. network.target was ready at 2.671 seconds, but could have started 233 milliseconds earlier if it wasn’t held up waiting for wpa_supplicant…
You may notice that some of the units identified by critical chain (e.g. dropbear) may not appear to be one of the worse offending units as shown by ‘systemd-analyze blame’ – that’s because a unit with a long initialisation time doesn’t necessarily translate to a unit on the critical path with a direct impact on overall boot time. As you can see, using ‘systemd-analyze critical-chain’ provides a good indication of what to focus on first – i.e. the units with the biggest +XXXms next to them.
However the critical-chain command is far from perfect. The critical chain produced by this command is constructed by looking at a target’s dependencies, printing the unit with the longest activation time and then repeating the process on the printed dependency. This often results in finding a ‘local maxima’ (try this on our example dependency graph) and is quite different from constructing a graph to calculate the true critical path. Also the algorithm will terminate early if the printed unit has only dependencies with no activation time (for example units of type OneShot). Thus it’s likely the output from critical-chain is incomplete. We’re currently working on some updates to improve this which we’re hoping to upstream in due course.
We’ve found that the best way to reduce systemd boot time is to start with ‘systemd-analyze blame’ to identify units that are not needed and remove them. We then make sure to understand the critical chain of the unit which starts the application – and we do this with a combination of the critical-chain command, examining units’ dependencies and by studying the plot. We can then ensure the dependencies are sensible and work to optimise the individual activation time of units in the critical path.
It’s much more complex optimising a parallelised system – however this parallelism provides for a far greater scope in achieving minimal boot times.